
Ceres · Power system planning software
Make long-term investment decisions with the full chronology of your power system. Ceres brings generation, grids, storage and flexibility into one planning environment for electricity network operators and regulators.
Cloud-based modelling powered by Pharoes’ patented acceleration technology.
Inside the platform
A closer view of your power system.
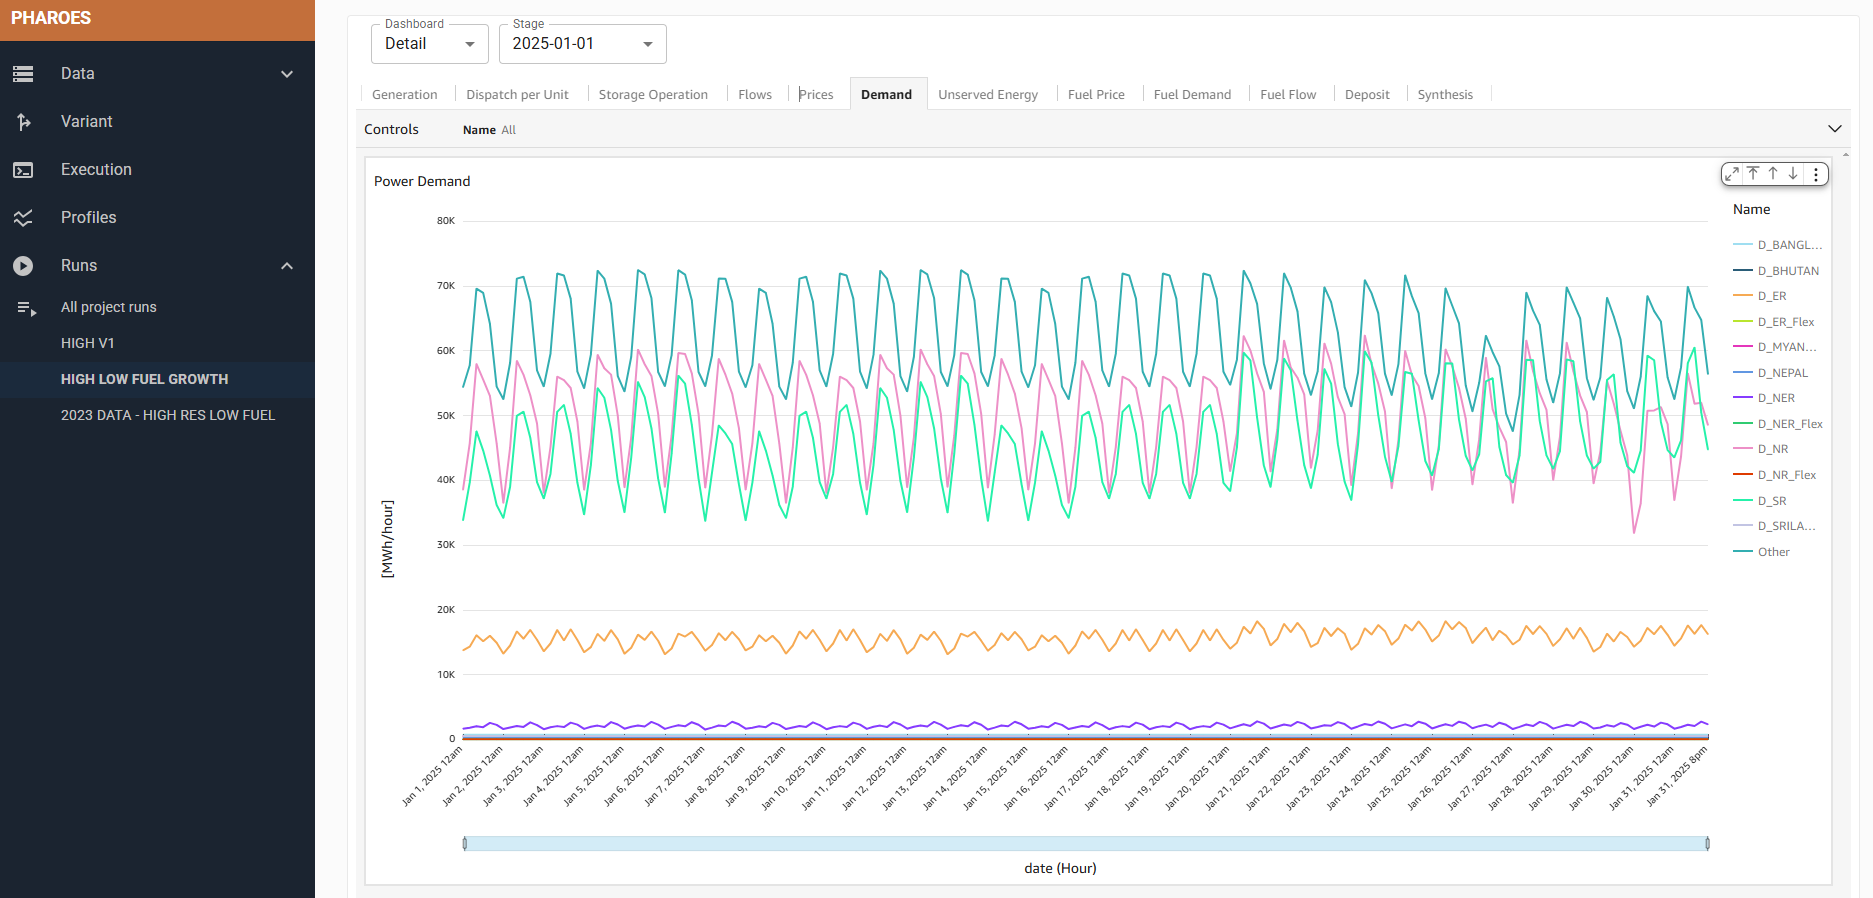
Explore generation by technology, region and time. Inspect the results behind each investment decision.
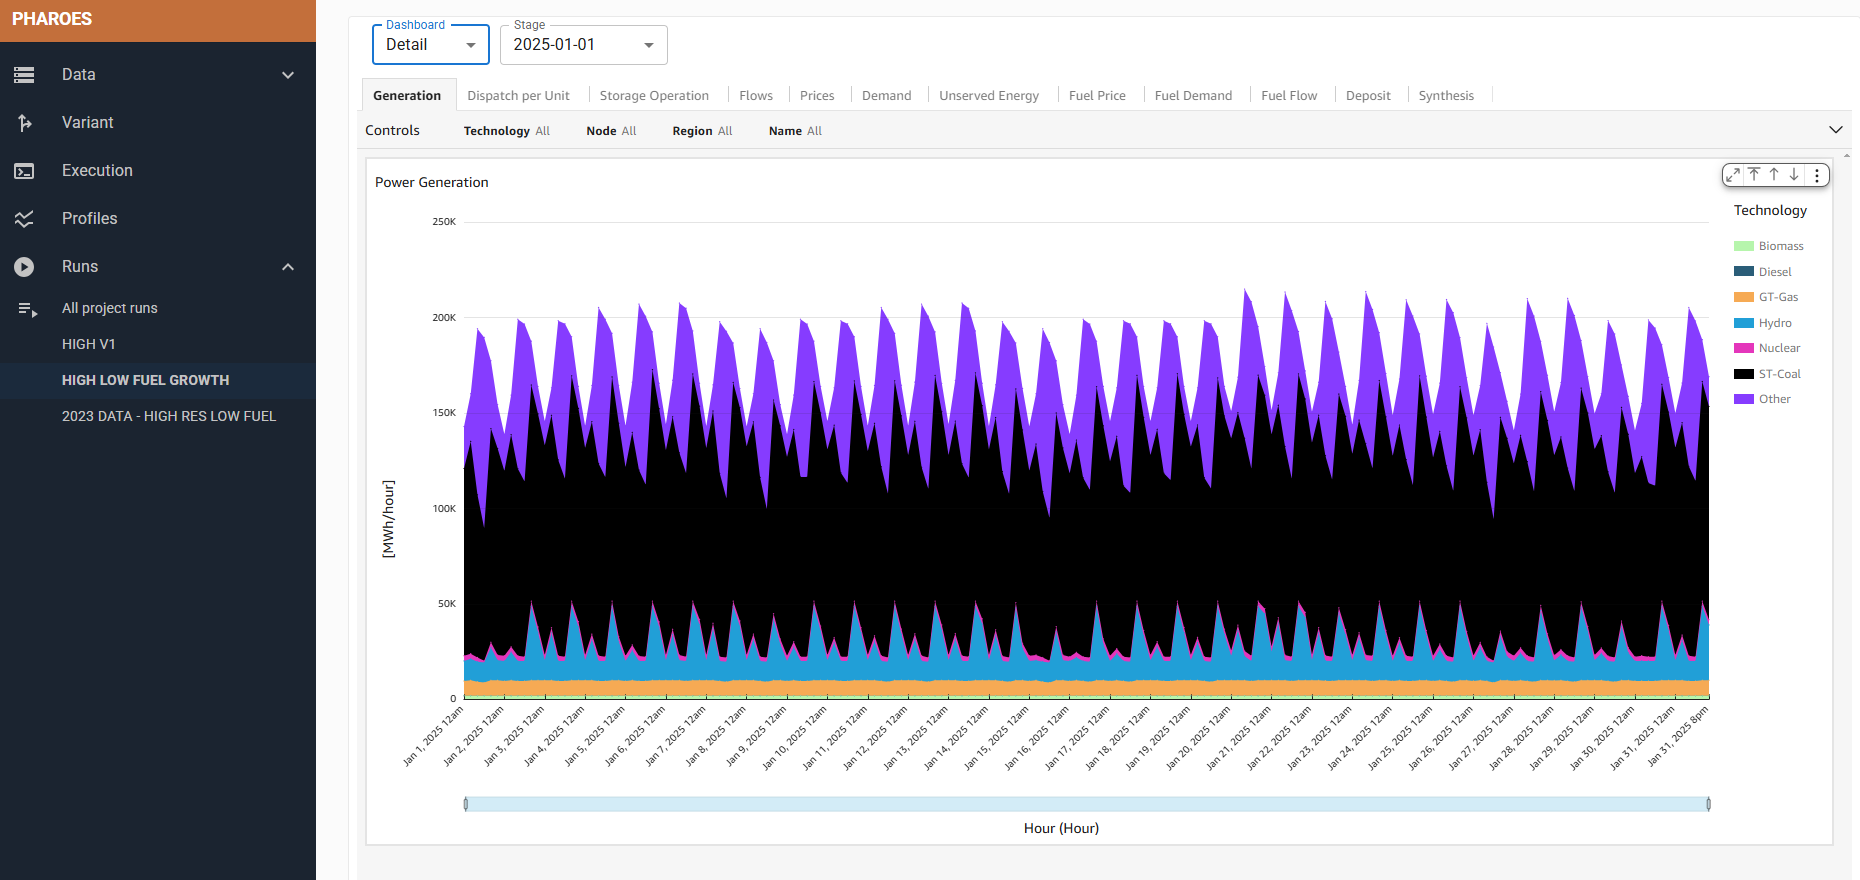
*Performance depends on the model and configuration. Example reported by Pharoes: 20 hours reduced to 1 hour.
Selected Pharoes clients
Experience across energy, international development and public institutions.







Pharoes also works with private global renewable energy investors.
Why chronology matters
The order of the days can change the investment decision.
When renewable output and demand vary hour by hour, averages tell only part of the story. A sequence of low-generation days can create needs that a set of isolated “typical days” fails to reveal.
The timing of generation and demand, the duration of scarcity, and consecutive storage charge and discharge cycles all affect the value of an investment. Ceres preserves chronological detail so these interactions can be evaluated together.
A better representation of system operation gives planning teams a firmer basis for comparing infrastructure and flexibility alternatives.
Deviation in investment net present value found in certain Pharoes comparisons using temporal simplifications.
Deviation in short-duration storage results in certain configurations analysed by Pharoes.
These are configuration-specific findings, not universal error rates. The distortion can arise from the calculation method even when demand and gas-price assumptions remain identical.
For scale: a 50% deviation on a €100 million net present value represents a €50 million valuation difference. This is an illustration, not a reported saving.
European-scale validation
One investment path. Around 50 zones. A 25-year horizon.
Using public data from TYNDP, the European network development plan, Pharoes tested Ceres on a system stretching from Portugal to Georgia.
Ceres jointly optimised investments in generation, networks, storage and flexibility over the full period. This connects investment decisions between years and assesses them against detailed system operation.
What the case demonstrates
Calculations for independent years can require around 24 hours, according to the reference supplied by Pharoes.
The complete European planning horizon was resolved in 2 hours and 45 minutes, with investments considered jointly across the period.
More temporal detail and consistency between years, enabling a more rigorous assessment of investment needs.
Case and timings supplied by Pharoes. The scope differs between the conventional reference and the full-horizon Ceres run; these figures are not a like-for-like speed benchmark.
Inside Ceres
From your system data to investment decisions.
Configure technical assumptions, manage temporal profiles and inspect scenario results in a shared cloud-based environment.
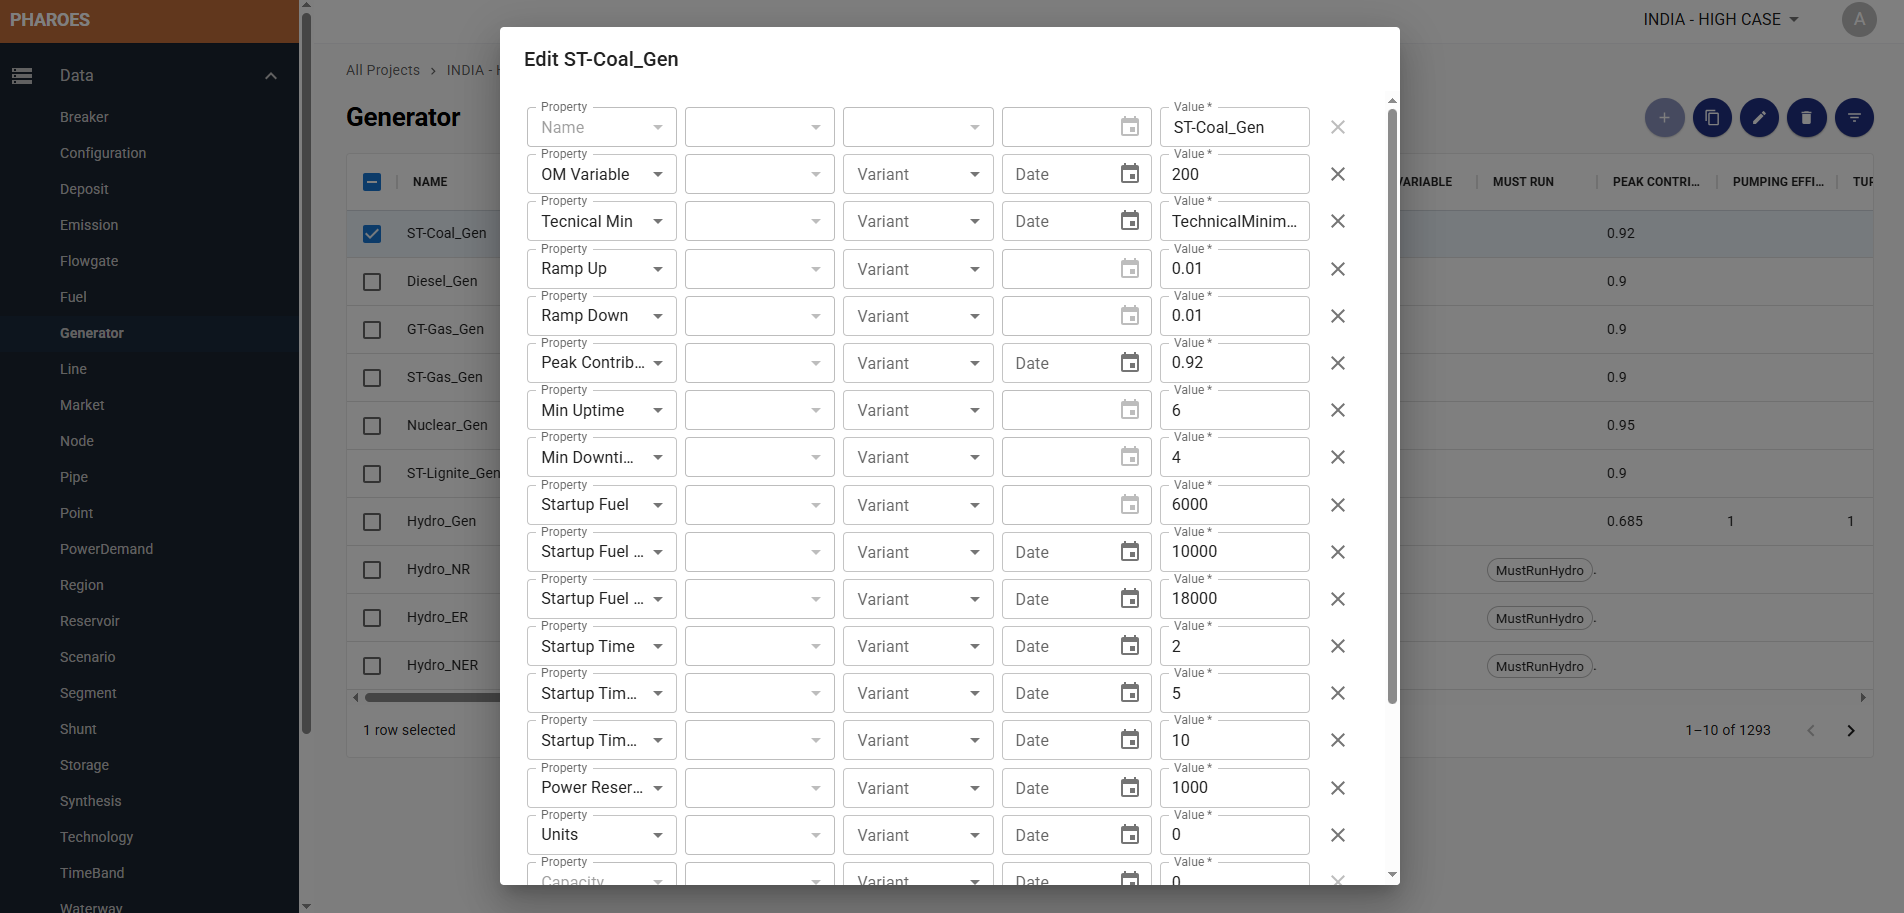
Keep operational detail in the model.
Define generation assets alongside networks, demand and other system elements. Include ramp rates, minimum operating levels and start-up requirements when assessing future operation.
Compare investment choices with the operating conditions that determine whether they deliver value.
Bring renewable generation and demand into time.
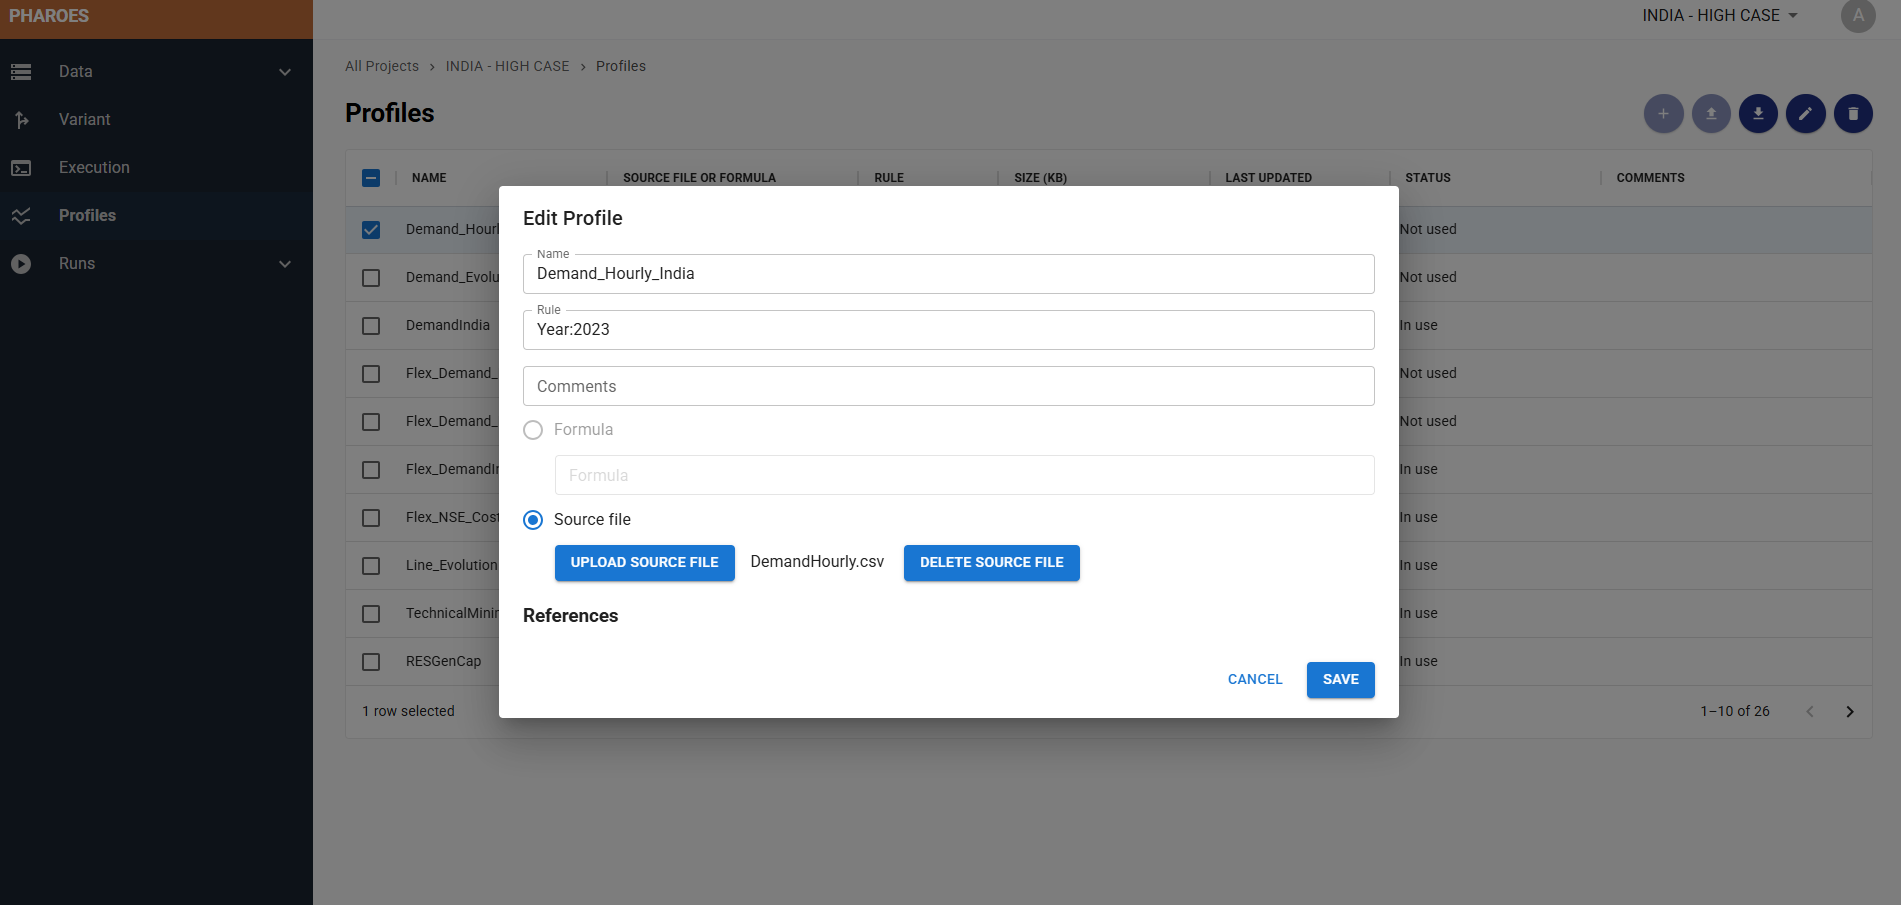
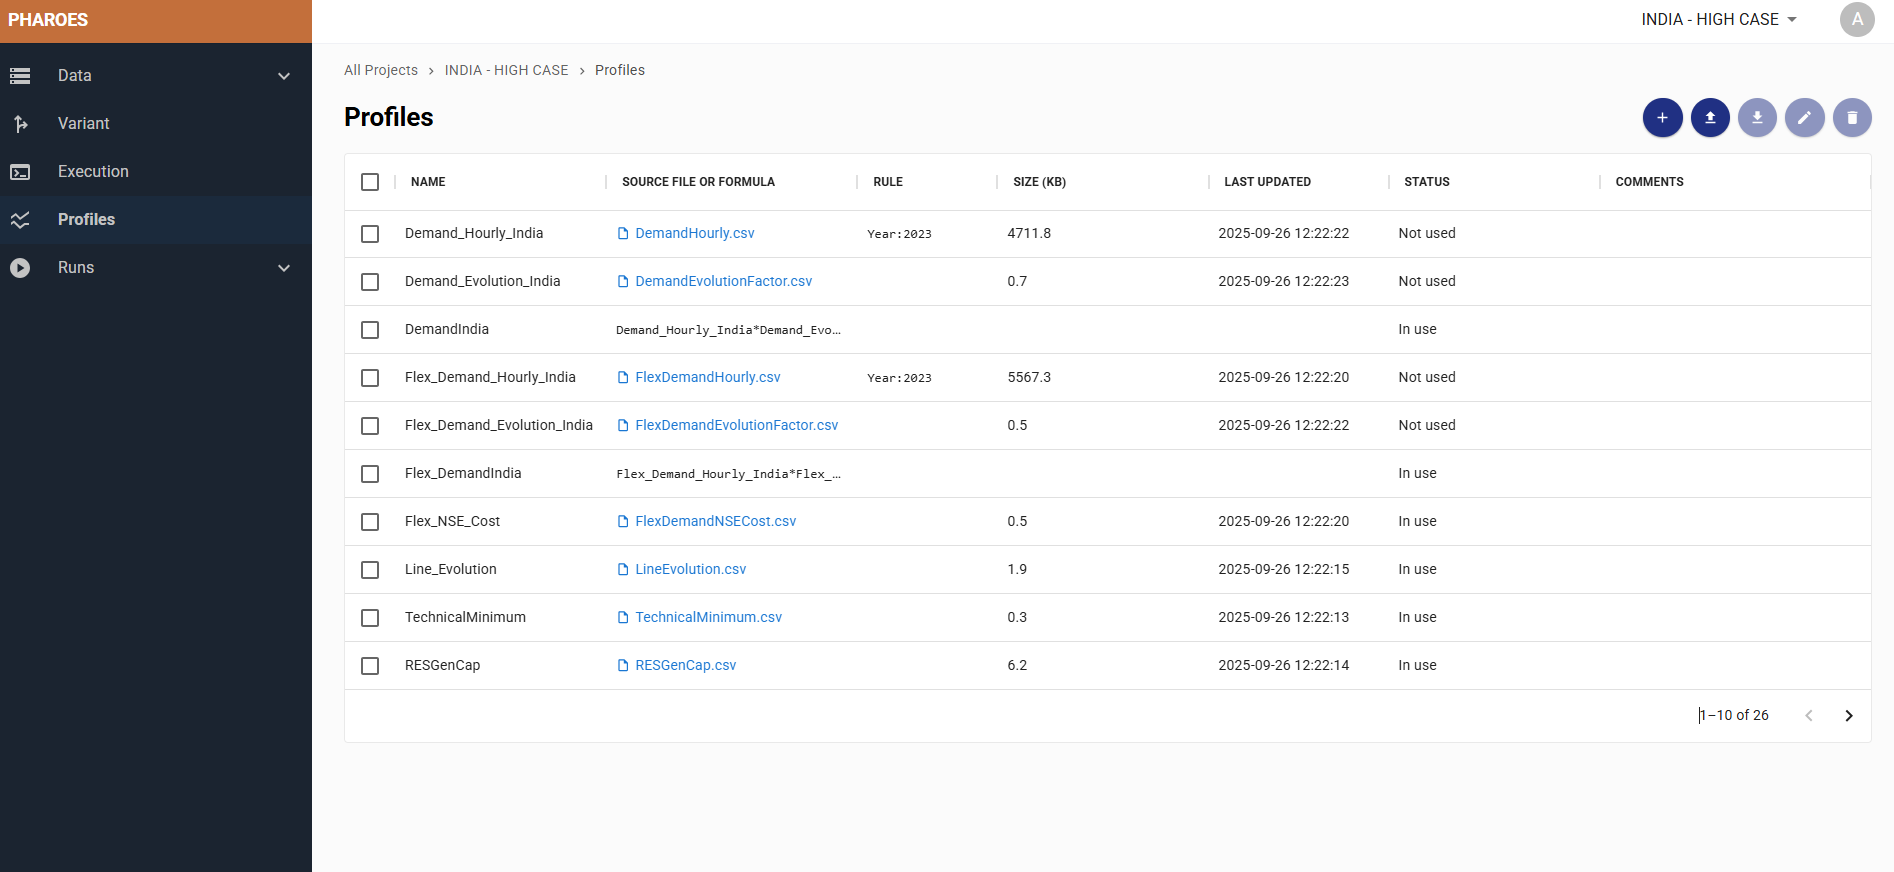
Manage profiles with source files, formulas and CSV imports. The walkthrough shows hourly, 15-minute and other intervals.
Keep demand, renewable output and flexible resources linked as assumptions evolve across your planning horizon.
Turn scenario results into a planning conversation.
Run scenarios, review their history and explore dashboards for generation, demand, storage, network flows and prices.
Filter and download results for analysis and stakeholder discussions.
Planning decisions
Evaluate the investments that work best together.
Assess infrastructure and flexibility in a consistent framework, with the temporal and operational detail needed for high-renewable systems.
Network expansion
Compare reinforcement needs with storage and flexible demand, and examine flows and constraints across the system.
Generation investment
Evaluate capacity additions alongside demand growth, renewable variability and long-term system development.
Energy storage
Examine charge and discharge sequences and the duration of scarcity when evaluating flexibility needs.
Hydrogen
Consider hydrogen investment alternatives together with generation, network and other flexibility choices.
Demand response
Assess how flexible demand interacts with generation, grids and storage under different planning assumptions.
Long-term pathways
Link investment choices across years rather than treating each planning year as an isolated decision.
Which investments does your system need to compare?
Product walkthrough
See the planning environment in action.
Explore the interface, data configuration, temporal profiles and interactive results in this short walkthrough.
The walkthrough includes an earlier performance description. The figures on this page reflect the updated comparisons and European validation supplied by Pharoes.
Built for your planning responsibilities
For network operators, regulators and policymakers.
Electricity network operators
Explore reinforcement and flexibility options, test renewable integration scenarios and identify long-term investment needs with detailed operational results.
Regulators and policymakers
Evaluate infrastructure and transition pathways, examine modelling assumptions and compare investment alternatives with consistent chronology across years.
Pharoes collaborators


Your Ceres evaluation
Start with the decision your system needs to make.
You may be comparing a network reinforcement with storage, planning new generation, or assessing a long-term transition pathway. The starting point is the investment question — and the operating conditions that could change the answer.
- Define the alternatives.Which generation, network, storage or flexibility investments need to be considered together?
- Keep the chronology in view.How do renewable output, demand and storage operation interact through scarcity periods and across successive years?
- Examine the implications.Which assumptions drive the result, and what detail do decision-makers need to compare the options?
Technology development support
Pharoes acknowledges support for the development of Ceres technology from CDTI, the European Union and Spain’s Ministry of Science, Innovation and Universities.
Questions before a meeting
A clearer starting point for your evaluation.
How does Ceres differ from typical-day planning?
Ceres represents the chronological sequence of system operation across a multi-decade horizon. This helps assess relationships that isolated representative days can miss, including prolonged scarcity and consecutive storage cycles.
What can be considered in the investment analysis?
Ceres supports joint analysis of generation, networks, storage and flexibility, including hydrogen and demand-response alternatives. In a meeting, Pharoes can review the elements and constraints relevant to your particular study.
What data can we bring to the discussion?
Start with your system geography, planning horizon, investment questions and available generation, network and demand data. The interface supports technical asset properties and temporal profiles based on source files or formulas, including CSV files.
Should we expect the same calculation times?
Calculation time depends on the model and configuration. Pharoes reports reductions of 10–20 times in its comparisons, including a 20-hour to 1-hour example. The separate European validation resolved a roughly 50-zone, 25-year horizon in 165 minutes. Pharoes can discuss a suitable evaluation for your model.
Can we see Ceres applied to our planning challenge?
Yes. Request a meeting with a short description of your system and study. Pharoes can discuss the modelling scope, demonstrate the relevant parts of the platform and outline the next steps for an evaluation.
Talk to Pharoes
Let’s discuss your power system.
Tell us about your network, planning horizon and the alternatives you need to compare. We will follow up by email to arrange a focused conversation about Ceres.
Prefer to email directly?
info@pharoes.com
A short description of your organisation and study is enough to get started.